
DRG analysis
Drill into cases by DRG, MDC and principal diagnosis, down to the individual case. That is usually where it gets interesting.

Transact product
When medical controlling is meant to do more than count after the fact.
DRG-View helps hospitals not only to evaluate case data but to understand it. That means looking more closely where revenue is lost, lengths of stay become conspicuous or cases could later turn unpleasant in audits.
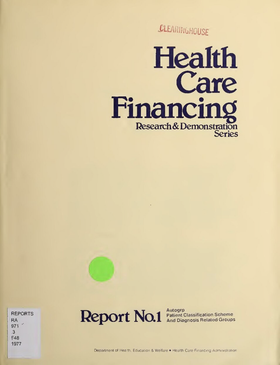
Yale University / Diagnosis Related Groups
Robert B. Fetter
„AUTOGRP patient classification scheme and diagnosis related groups (DRGs)“ by Robert B. Fetter et al., U.S. Department of Health, Education & Welfare / Health Care Financing Administration, 1977
Source: AUTOGRP Patient Classification Scheme and Diagnosis Related Groups (DRGs), digitised copy via Internet Archive / Wikimedia Commons · Licence: Public Domain in the USA (PD-US-no-notice) · Image credits
In 1977 this report appeared on a new method for classifying hospital patients: Diagnosis Related Groups – DRGs. The idea behind it was as simple as it was far-reaching: medically similar hospital cases can be systematically grouped and compared using their data. A research project became a concept that has changed hospital management worldwide. DRG-View carries this idea on: recognising connections in case data – and acting on them.
DRG data is not difficult because it looks complicated. It is difficult because so much depends on it.
Lengths of stay, coding, grouping, revenues, supplementary payments, audits and deviations together create a system you can’t master with a few standard reports. In daily work you need the ability to see through cases, recognise patterns and find anomalies where they actually arise.
That is exactly what DRG-View is for.
The product doesn’t help present hospital data more prettily. It helps bring it into a form that controllers, doctors and management can really work with. Anyone who has dealt with hospital data for long enough knows anyway: the problem is rarely that there are no numbers at all. The problem is that nobody understands quickly enough which of them matter right now.
Drill into cases by DRG, MDC and principal diagnosis, down to the individual case. That is usually where it gets interesting.
Spot developments and deviations in the case mix index early enough, instead of just looking at it.
Evaluate short stays, long stays and average lengths of stay in a way that turns an anomaly into a question.
Flag cases, identify documentation gaps and find unpleasant surprises before the audit wherever possible.
Understand budget effects, supplementary payments and surcharges or deductions, instead of just booking them.
Tailor evaluations so that departments don’t see everything, but see the right things.
The company behind DRG-View and why its history in healthcare matters so much to us.
Hospital benchmarking based on official quality reports and structured comparison data.
The bigger picture: how we think about data, analysis and decisions overall.