
Service
If you need a custom evaluation, we also deliver it as a report, without any installation of your own.

Q.B.X
Q.B.X works with structured data from official reports and registers. That is exactly what makes visible how medical institutions compare, where the patterns are and where individual figures turn into a reliable assessment.
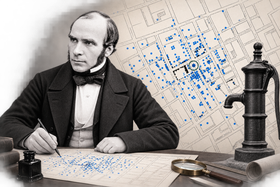
London / Cholera map 1854
John Snow
Today is Life, 2026
Source: AI-generated illustration, historically inspired by John Snow’s cholera map of 1854 and public-domain depictions of John Snow · Licence: Image created with AI – Today is Life · Image credits
In 1854, John Snow had neither a dashboard nor a database. He had a map. Snow marked the deaths from a cholera epidemic in London by location. That made visible what would hardly have stood out in tables: the cases clustered around one particular water pump. Individual medical data points became a spatial pattern – and the pattern became an insight. That is exactly the idea behind Q.B.X today: bringing data together, making connections visible and enabling better decisions.
A hospital can know its own figures quite well and still know little about how to place them in the bigger picture.
That is exactly where benchmarking becomes interesting. Not as a competitive game, but as a way to put anomalies in context, compare developments and understand your own position beyond gut feeling.
Q.B.X works with official quality reports and structured register data. That sounds dry at first. But it is exactly the kind of basis on which comparisons become meaningful at all. Because a comparison only helps if you can rely on it not comparing apples with oranges, and both of them with an Excel helper column.
If you need a custom evaluation, we also deliver it as a report, without any installation of your own.
For hospitals that already run Qlik themselves and want to integrate the evaluations into their own infrastructure.
When flexibility matters more than a local installation and access is to be organised more simply.
Use data and results further wherever they are still needed in your own organisation.
When it is more about individual cases, revenue, lengths of stay and medical controlling.
For process key figures, utilisation and what becomes organisationally measurable in the operating theatre area.
The bigger picture: how we think about data, analysis and decisions overall.