
pame
Associative business intelligence instead of report after report. For everyone who wants to move through the connections in the data.

Business Intelligence
better decisions
Business intelligence brings data from many systems together and turns it into decisions. We build BI systems for hospitals and companies that let you not only see key figures but find causes and understand connections. In healthcare we have had experience since 1994, where data seldom sits neatly waiting for you.

London / Data-based decisions
Florence Nightingale
„Florence Nightingale CDV by H Lenthall“ by H. Lenthall, London, ca. 1850er
Source: Wikimedia Commons (Original: Heritage Auctions) · Licence: Public Domain (PD-US) · Image credits
Editing: Already cropped, contrast-corrected and retouched at Wikimedia Commons; additionally cut out and edited for Today is Life.
Florence Nightingale became famous as the “Lady with the Lamp”. For business intelligence, though, another side of her work is far more interesting: she worked with data. Nightingale systematically collected health and mortality data, analysed connections and developed visualisations with which she made her findings understandable to politicians and administrators. She didn’t want more data. She wanted data to turn into better decisions. That is exactly what business intelligence is about to this day.
Over the years, business intelligence has become ever prettier.
We used to get endless lists on green-and-white paper from the printer. Then came Excel, reporting systems, OLAP cubes and eventually dashboards. Today you can practically have any key figure displayed in any colour you like. With speedometer, traffic light and world map, if you absolutely must.
That is progress. It is just that a dashboard mostly answers questions that someone already knew beforehand.
What is the revenue? How many cases did we have? How is the length of stay developing? Which cost centre is over plan? What is the utilisation?
Dashboards are excellent for that. It is just that the real analysis often begins exactly where the dashboard ends.
You see, for example, that the length of stay in a hospital has gone up. Good. Or rather not good. But now at least you know.
The interesting question is: why?
Perhaps the longer length of stay doesn’t affect the whole hospital at all. So you look at the departments. One department stands out. So you look at the DRGs. Then at diagnoses. At wards. At doctors. At admission and discharge days.
And at some point you find out: this happens mainly with a particular case group, and there remarkably often with patients admitted toward the end of the week.
Now you have found something out.
The problem: when the dashboard was built, nobody knew you would one day ask exactly this question. How could they?
This is the point where classic reporting systems like to get a bit stubborn. For the next question you need a different report, an additional dimension or someone from IT.
Or you export everything to Excel.
After over 30 years of business intelligence, that has a certain comedy. But also a good reason.
In Excel the user can do with the data whatever they want. They can sort, filter, try things out, put two things side by side and follow an idea that has only just occurred to them. Because that is simply how analysis works. You don’t know the fifth question until you have seen the answer to the fourth.
This is the part of business intelligence that has always interested me most.
Data is connected.
A customer orders a product. The order was handled by a salesperson. The customer is in Hamburg. The product belongs to a product group. The order was delivered in March and complained about in April.
Of course you can turn that into six tables and twelve reports. But you can also see it for what it is: a connection.
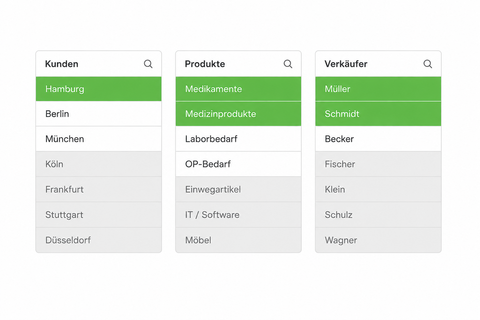
When I select Hamburg, I therefore don’t only want to see the revenue from Hamburg. I want to see at the same time which customers belong to it, which products these customers bought, which salespeople were involved, when it happened and which complaints are connected.
And then perhaps I also select a product group.
Everything changes again. Certain customers still belong. Others no longer do. Some salespeople remain. Certain months, too.
And suddenly I can move through the data. Not through reports. Through connections.
Anyone who has worked with associative systems for a long time, by the way, eventually develops a strange relationship with the colour grey.
Because what is interesting is not only what belongs to a selection. What doesn’t belong is interesting, too.
Suppose a certain product sells extremely well in Hamburg. We select Hamburg and this product and immediately see the customers who bought it.
So far, expected.
But at the same time we also see the customers in Hamburg who did not buy this product. And they can be considerably more interesting for sales.
Or in a hospital we select a particular diagnosis and see the associated procedures. At the same time, though, we also see which procedures do not occur in these cases.
Why not?
No idea. But now you can look.
And this is exactly where reporting becomes analysis.
The principle behind it is actually astonishingly simple.
The data is linked through its relationships. A selection doesn’t simply narrow down a report but changes the entire data space. You see what belongs to the selection, what is still possible and what has been excluded.
That means you don’t have to know beforehand which path an analysis will take.
I consider that a pretty important difference.
A report says: here is the answer to the question we planned for when building the report.
An associative system says: here is the data. Get started.
Of course you still need dashboards. At nine in the morning a managing director doesn’t want to spend half an hour exploring data just to find out what the revenue looks like. That is what key figures and standard reports are for.
But if something looks odd there, they should be able to get further. Without ordering a new report. Without SQL. And preferably without the by now traditional button: “Export to Excel”.
Because business intelligence shouldn’t consist of displaying as much data as possible as prettily as possible.
It should help you find something out. Sometimes even something nobody asked about beforehand.
Associative business intelligence instead of report after report. For everyone who wants to move through the connections in the data.
In development
The multi-user and server side of pame. This is where you manage approvals, roles and access, so that a single application becomes a shared system.
Concept
This is where data becomes concrete workspaces: evaluations that you keep building on and share, instead of just reading them.
Medical controlling & revenue optimisation for hospitals. Analyse case-based flat rates (DRG), CMI and length of stay.
Nationwide hospital benchmark. Compare your KPIs with over 200 German hospitals.
Operating theatre management and utilisation optimisation. Get more out of your most valuable resource.
With Transact, our subsidiary and partner, we share a lot of experience in healthcare. There you quickly see whether BI just looks pretty or helps in everyday work.
30+ years
of experience in healthcare
200+
hospitals use Q.B.X
100 %
Qlik-based
If decisions at your company are still made by feel too often although the data has long been there, we should talk. Not about twenty new charts. But about which questions you actually want to answer.