
Theatre utilisation display
Understand utilisation over time periods and in comparison, instead of seeing it only on a screenshot.

Transact product
When operating theatre data is meant to become more than a statistic after the fact.
OP-View shows how the operating theatre area really runs: utilisation, changeover times, overtime, plausibility checks and key figures are prepared so that you can do something with them organisationally.
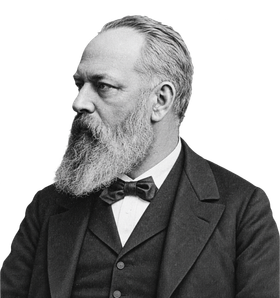
Vienna / Modern abdominal surgery
Theodor Billroth
„Theodor Billroth“ by unknown (according to Wikimedia Commons), 1887
Source: Wikimedia Commons (source given there: clendening.kumc.edu) · Licence: Public Domain (PD-old) · Image credits
Editing: Image edited (AI-assisted) from the 1887 photo “Theodor Billroth”. Changes: cut out, upscaled, hair, beard and posture newly generated. Edited by Today is Life.
Theodor Billroth belonged to a generation of surgeons who fundamentally changed the operating theatre. Operations increasingly became plannable processes with a division of labour – with preparation, specialised teams, defined procedures and systematic evaluation of results. Today the operating theatre is one of the most complex and most expensive areas of a hospital. Good medicine there therefore also needs good organisation. What Billroth systematised, OP-View makes measurable.
It is also one of the most demanding areas of a hospital organisationally.
When time is lost there, shifts run over, changeover times get longer or capacity is poorly used, that is not just a small process problem. It gets expensive very quickly. And usually you do notice it somehow, but not precisely enough.
That is exactly where OP-View comes in.
The product makes operating theatre processes visible so that gut feeling can become a solid discussion. So not just: we have a feeling that today was chaotic again. But: where exactly do idle times, overruns, bottlenecks or utilisation problems arise? And which patterns actually run through the operation?
Understand utilisation over time periods and in comparison, instead of seeing it only on a screenshot.
Think about data quality first, before discussing processes on the basis of skewed numbers.
Integrate key figures so that they fit the reality of the hospital and not just the template of a dashboard.
For when you want to follow up in the data itself rather than only look at aggregates.
Use reports where decisions are made, not only at a fixed workstation.
Roll out key figures for areas and roles so that they make a difference in daily work.
15%
less changeover time
10%
more operations per theatre
20%
less overtime